Governor Janet Mills August 10, 2023
1 State House Station
Augusta, Maine 04333
Re: A request that the Maine Department of Environmental Protection (MeDEP) reopen the Sebago Lake Water Quality Certification (WQC) for FERC Project No. 2984-080 to address and correct the following:
- MeDEP’s justification for their Sebago Lake WQC lake level management requirements is based on errors in State “Findings of Facts” in the present WQC that is causing continuing significant erosion of shorelines and beaches with resulting harmful water quality impacts of especially nearshore waters.
- The impacts of the present extreme outflow regulation are harmful to water quality, water temperature, and ecosystems of Sebago Lake, the Presumpscot River, Presumpscot River estuary, Casco Bay, and the Gulf of Maine.
- The State of Maine has shown major social and socio-economic bias inherent in the 2011 WQC requirements for the economic benefit and convenience of special boating and real estate interests.
Dear Governor Mills,
On September 30, 2011, the Maine Department of Environmental Protection (MeDEP) filed a Water Quality Certification (WQC) for the relicensing of the Eel Weir Dam, Federal Energy Regulatory Commission (FERC) Project 2984. FERC incorporated the lake outflow and water level management requirements of the MeDEP WQC into the FERC relicensing which was issued on March 23, 2015. The MeDEP’s WQC lake level guidelines, now requirements of the FERC 2015 relicense, are furthering the erosion of Sebago Lake beaches and shorelines. It has become clear that the regulation of lake levels dictated by MeDEP’s 2011 WQC has far-reaching water quality and ecosystem impacts not only to Sebago Lake but also the Presumpscot River and its estuary, and Casco Bay.
We respectfully ask that you take the necessary actions to require MeDEP to modify the WQC to mitigate the new pronounced erosion and address the additional impacts which are explained in the body of this letter.
RDW FOSL letter to Gov. Mills August 10, 2023
1. Maine’s Authority to Reopen the 2011 MeDEP WQC
The State of Maine has the authority to reopen the WQC for Sebago Lake as stated in the September 30, 2011 WQC filing to FERC. Number 7 MeDEP WQC 2011
“In summary, the MDEP has certified that the continual operation of the Eel Weir Project meet applicable water quality standards, subject to the following conditions.”
“Upon any future determination by the MDEP that the water quality of Sebago Lake is declining and that the operation of the Eel Weir Project, as approved by this certification and as conditioned by the new FERC licenses for the project, may be causing or contributing to this decline in water quality, the Maine DEP reserves the right, after notice to the applicant and opportunity for hearing, to reopen this certification for consideration of requiring such modification of the lake level management plan in effect for the project as may be deemed necessary to ensure that the operation of the project does not cause or contribute to any (emphasis by RW) decline in the water quality of Sebago Lake.”
2. Stark Inconsistent Record of State Leadership Regarding Scientific and Historical Rationale for Managing Sebago Lake Water Levels.
The FERC license incorporated the recommendations of the MeWQC for Project 2984 issued on March 23, 2015. The State of Maine’s justification for the lake level parameters of its 2011 WQC were based on information that conflicts with past opinions of the State’s own experts and volumes of evidence recorded in the file for FERC Project P-2984.
The State’s abrupt contradictory positions in determining Sebago Lake management is best exemplified in official State email correspondence brought to light in a Freedom of Information Act (FOIA) search of State records by the Friends of Sebago Lake (FOSL). The email correspondence is between Robert Marvinney, the Maine State Geologist , and Dana Murch, the State Hydropower Co-ordinator.
RDW FOSL letter to Gov. Mills August 10, 2023
“Date- December 30, 2003
From: Robert G. Marvinney
To: Patrick McGowan, Dawn Gallagher, Dana Murch, Danny Martin cc: Tom Skolfield
I have been reviewing the comments from our meeting on Dec. 6, and the letters that have come in since and offer the following…
3. Beach accretion is a slow process. In the late winter and early spring of 2002, we saw significant accumulations of sand (emphasis by RW) that moved at least part way up the beaches in response to rising water levels and waves. This was following the fall and winter low lake level that bottomed out at 260.8 feet. Accretion works but it needs to be given a chance. A one time effort will not work. Eliminating the provision to drop the level to 261 feet periodically will also drastically reduce the effectiveness of the accretion process. (Emphasis by RW) Personally, I believe the catastrophic lows, well below 261 feet, have benefited the beaches the most, much in the way the catastrophic highs have caused the most damage. But I have no direct data to support this viewpoint.
What to Do?
A. Don’t give up the 261 fall water level. It is the only thing that promotes accretion of sand.” (Emphasis by RW)
The Maine DEP Hydropower Coordinator, Dana Murch, who later in 2011 wrote the present WQC, responded the same day in agreement to Robert Marvinney’s email.
Email from Dana Murch to Bob Marvinney, Patrick McGowan, Dawn Gallagher, Danny Martin
“Date: December 30, 2003 12:33pm
Cc: Tom Skolfield
Subject: RE: Sebago Lake”
“I agree with Bob Marvinney’s analysis (see below) In the end, I don’t see any compelling reason to change the plan that is currently in place.
I agree with Bob Marvinney’s recommendations, with the following additional comments: A. Keeping the periodic low fall level of 261 in place makes sense, at least until we can determine if it results in sands being restored to beaches.”
3. Eight years later, Robert Marvinney, the Maine State Geologist, in a July 8, 2011 letter to FERC, wrote the following in great contrast to his December 30, 2003 memo:
• “2) The 2-in-9 year requirement in the current LLMP to lower the fall lake level to 261 feet MSL should be eliminated (emphasis by RW). The intention of this requirement was to promote transport of sand up the beach from deeper areas around the shoreline as water levels rose during spring snowmelt. In practice, this target has been elusive for a number of reasons, not the least of which has been the frequency of significant late fall rain events in the past ten years. Furthermore, while the Maine Department of Conservation’s Maine Geological Survey (MGS) has noted sand run-up on Sebago Lake State Park beaches following successful lowering of the lake to the 261-foot target, the volume of sand so moved has been insufficient to have a significant impact on the beaches of Sebago Lake State Park.“
4. FERC recognizes MeDEP 2011 lake level plan’s bizarre switch in policy.
The State of Maine’s abrupt change in lake level policy was noted in FERC’s Environmental Assessment. Their comment is on p.11 of the Supplemental Environmental Assessment, FERC 4/08/2014.
Page 11, Footnote 20 states: “On May 13, 2004, the State of Maine filed recommended changes to the operating parameters for Sebago Lake that represented the consolidated recommendations of all State of Maine agencies. On August 30, 2011, MDEP issued a WQC with conditions that are inconsistent with the State of Maine’s 2004 recommendations, mostly consistent with S.D. Warren’s 2011 proposal, and supersede all prior recommendations by individual State agencies.” (emphasis by RW).
5. What led to the State agencies’ bizarre decision to eliminate the 2 in 9 year lowering?
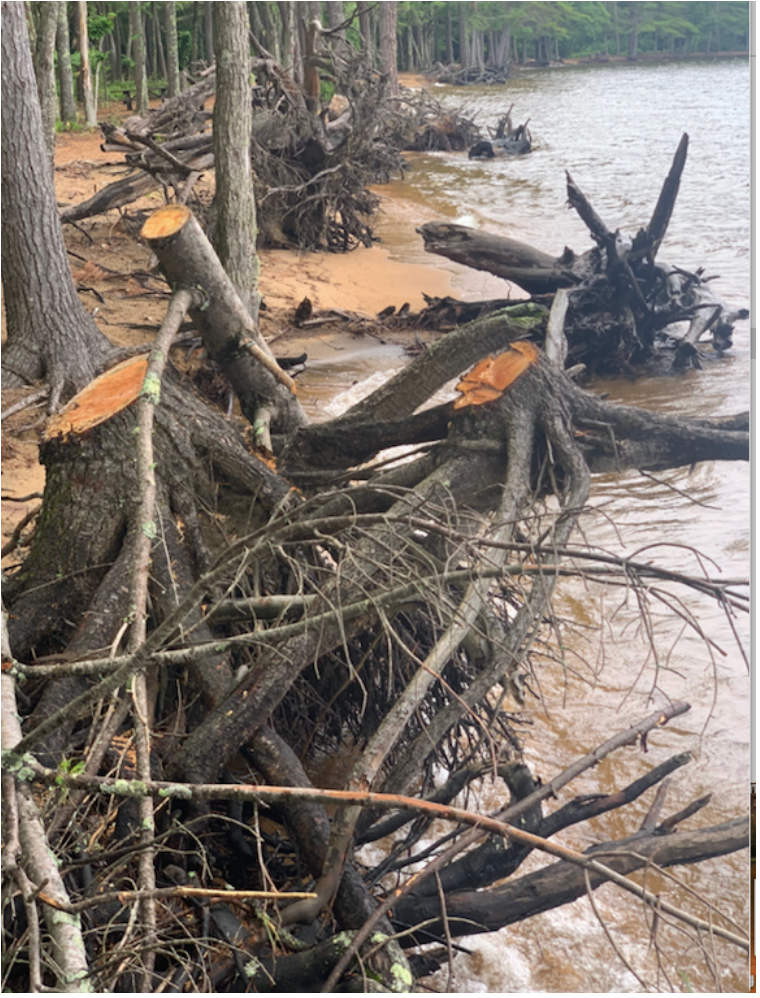
Between 2003 and 2011, the lake shorelines suffered from two extreme high-water storm event episodes in 2005 and 2008, which resulted in severe and irreversible erosion to non armored shorelines exposed to storm wave action. MGS never published a beach profiling study to quantify sand loss or gain covering the 2003-2011 period. These are the years that the reversal of opinion of MGS and DEP were based on. Only one 2 in 9 year late fall 261 msl lowering (2007) occurred between 2003 and 2011. SAPPI (South African Pulp and Paper Industries) quickly brought the lake back up in late December of 2007 from 261.0’ msl, allowing very little time for adequate sands to be restored in a “a slow process” (Marvinney Dec. 2003 email),to the beaches. Not mentioned in the 2011 WQC is that the 2007 year was sandwiched among 6 springtime high-water years, 2004, 2005, 2006, 2007, 2008, and 2009 where levels exceeded full pond, violated the flowage easements, remained at or above 266’ msl for over two months and remained above 266.0 msl for approximately 3 months respectively. In this 9 year time frame, Maine DEP and the Department of Conservation received much photographic evidence of new shoreline damage including Songo Beach at Sebago Lake State Park. They showed no interest nor responded to citizens letters complaining of the damage. The added numbers of DEP permits obtained by private property owners for shoreline protection attest to the destabilization of shorelines in the 2003-2011 time frame. Dana Murch never mentions the number of DEP erosion protection permits for Sebago Lake in State correspondence or in submissions to FERC. During the high-water years after 2003, a multitude of up to 150 year old trees at Songo Beach, once Maine’s finest inland beach, were undermined by high water wave action and toppled over, requiring removal by State workers. Robert Marvinney does not mention this destruction and loss of land during the post 2002 years. Songo Beach suffered greatly, yet the Department of Conservation and the MGS remained silent on the need for a WQC that addresses the accelerated erosion. The State Geologist’s emphasis of “insufficient restoration of beach sand” during a lowering that lasted about one week surrounded by multiple years of exceptional high water and catastrophic erosion ignores the physical laws at work that govern the present beach dynamics. If normal late fall rains were too problematic to lower the lake as stated in the WQC, Robert Marvinney should have suggested expanding the 261 msl two month November and December window to include at least allowing the lake level to be lowered on October 1st.

We will probably never know if Robert Marvinney’s career and appointment were under pressure from the Lepage administration’s desire to cater to the expressed demands of SAPPI, the marinas and high-water real estate interests. A more likely reason, I believe, for the MGS’s sudden departure from decades of the MGS and other Department of Conservation staff recognizing and espousing the importance of sustained low lake level periods to accrete sands up on beaches and offset erosion was that the Lepage administration threatened budget cuts that would eliminate staff and/or funding for ongoing future MGS projects unless changes demanded by high water interests were included in the WQC. Robert Marvinney’s lifetime of work for the State of Maine is exemplary as the record of publications, studies, and presentations he has been involved in are self-evident. Therefore, it is not unreasonable to question whether or not his contradictory and unsupported scientific opinion expressed in his July 8, 2011 letter to FERC (DocumentAccession #: 20110708-5061) that justifies the WQC’s elimination of any water levels below the 50th percentile of historical levels surely was forced by the highest administrative levels of the State of Maine.
5a. MeDEP reversal of support for 2 in 9 year lowering discussion.
In the 2011 MeDEP WQC, Dana Murch, the MeDEP hydropower coordinator and author of the WQC, at the urging of SAPPI, marinas, and high-water real estate interests, eliminated the 2 in 9 year fall lowering of the lake provision without any documented justification from the Maine Geological Service. In the 2011 WQC, Dana Murch, to justify the State’s new position to eliminate the 2 in 9 year lowering refers to earlier beach studies by SAPPI and Maine Geologic Service (footnote 81 WQC) which spanned time periods in the earlier 1990’s and early 2000’s where annual water level averages more followed long term historical averages. In 2003, when Dana Murch made his supporting comment for the 2 in 9 year lowering, he was fully aware that the earlier MGS 1990’s short term studies included drought years with levels remaining well below full pond and did not erode shorelines at the rate which occurred in the late 1980’s. There were no studies after 2002 to document the accelerated shoreline erosion rates occurring in normal or above average precipitation years. The resurgence of erosion after 2002 was due to increased lake level averages and incidences of extreme high water caused by flow parameters allowed by the MeDEP’s 1997 Water Level Plan. A resulting lack of storage capacity occurred more often after the 1987 change in outflow regulation. SAPPI or prior ownership of the dam had a long standing policy of shutting off flow at Eel Weir dam anytime the Presumpscot River was subject to flooding. As a result, with a lack of storage capacity due to the DEP lake level mandates, water levels more often reached or exceeded full pond and on occasions, the flowage easements. The only action to offset these high-water events and the redistribution of annual wave energy onto the upper profile of the beaches and shorelines caused by the post 1987 higher lake level averages was the 2 in 9 year lowering.
5b. Errors in WQC “Finding of Fact” Discussion
Section 3: MeDEP WQC, Description of Existing Project Facilities
P10 “Prior to the construction of any dams at the outlet of the lake, lake levels vary between a minimum of about 256 feet msl and a maximum of about 258 msl and outflows varied from a minimum flow of about 40 cfs and flood flow of about 29,000 cfs.”
The historical record that MeDEP establishes in the WQC as a “Finding of Fact” is not supported by available historic information. This is important because any outflow regulation should incorporate an understanding of accurate historical flow for safety and environmental reasons. Nowhere in the historical record have the Friends of Sebago Lake been able to find any verified measured lake level heights of Sebago Lake before the building of the Cumberland and Oxford Canal Dam at the Basin Outlet. In the WQC “Finding of Fact and Order,” Dana Murch states without reference that “256’ to 258 feet msl” is the Sebago Lake historic lake level range. A multitude of evidence contradicts Dana Murch’s “Finding of Fact and Order”. Nathaniel Hawthorne, born in 1804, kept a diary when he was a teenage boy living in Raymond, Maine. In one passage it is written that he commented that by the end of summer it became possible to walk the shorelines for great distances. Sebago Lake was known to have wide beaches and this was only possible on a large lake with sizable lake level fluctuations. A “two foot maximum fluctuation” for a lake that is stated as fact by the WQC is implausible especially in an often high seasonal snowpack laden region. The Sebago Lake outlet at White’s Bridge is a natural constriction of the water flow. It is highly probable the outlet was more constricted, forcing higher lake levels before boulders and rocks were removed to allow passage of 60 foot sailing canal boats when the 1828 Canal was completed. The 1828 Basin Dam, about one mile below Sebago Lake, more maintained the water level of the Basin with the level of Sebago Lake so canal boats could navigate up into Sebago Lake until ice-in occurred.
It is likely that Sebago Lake had a natural hydrograph more similar to Flathead Lake in Montana with a high peak in the spring, not a two foot range as the WQC states as fact. Flathead Lake and Sebago Lake are somewhat similar in their history of impoundment by a dam but differ as to when seasonal lake level cycles diverged from what had occurred under natural conditions. FERC staff introduced Flathead Lake to the Friends of Sebago Lake upon a request for information about lakes comparable to Sebago Lake. After the 1878 dam modifications were completed at the Basin Dam, erosion was not immediate and catastrophic like on Flathead Lake. In fact, Sebago Lake’s beaches, when heavily photographed in the early 1900’s, provided evidence of their outstanding nature. For one hundred and ten years Maine would still possess Maine’s finest inland beaches (Maine State Planning Office 1988) ( See Appendix B). Kerr Dam impounding Flathead Lake did not raise water levels higher than the record natural high level. Kerr Dam did increase the average annual level significantly. Beach and shoreline erosion rates were initially severe for the first 30- 50 years. If Dana Murch’s “Finding of Fact and Order” was correct, the 8 to 9 foot increase by the 1878 dam would have caused massive erosion and flooding of land immediately after 1878 clear into Long Lake. The concept of significantly increasing lake level averages above established historical averages and the resulting destruction of Maine’s finest inland beaches starting 110 years after the present 1878 Sebago Lake Dam height was established, irresponsibly escapes mention in the entire MeDEP’s WQC submission to FERC.
Dana Murch received a letter dated June 23, 2009, by Stephen M. Kasprzak (see Appendix 1) with the subject heading: “S. D. Warren’s Pending Application for Water Quality Certification (WQC) For Eel Weir Dam Hydroelectric Project FERC #2984 Should Take Into Account The Fact That Sebago Lake is A Natural Lake With Natural Wetlands and Eel Weir Did Not Raise The Natural Lake Level By 9 Feet”.
Dana Murch appears to have willfully ignored important Sebago Lake water level historical information and common sense observations provided to him in Mr. Kasprzak’s letter when he justified the lake level requirements of the WQC, which are now embedded in the FERC license for Eel Weir Dam Project 2984. He received this letter only two years before he wrote the WQC. It should be noted that Kasprzak’s letter was also sent to the Commissioners of Environmental Protection, Conservation, and Inland Fisheries and Wildlife. Dana Murch’s gross historical errors cited as “Finding of Fact and Order” stand alone as reason for reopening the Sebago Lake WQC.
5c. WQC Increases Erosion Factors
Three erosion factors controlled by a dam on a large lake like Sebago Lake or Flathead Lake are: an increased transgression time, reduced lake level range, and an elevated lake level. In lake level terms, the transgression time is the length of time it takes for one annual lake level cycle to occur. The WQC has boosted all three of these erosion factors. Sebago Lake’s transgression time occupies a greater percentage of the year. Since 2016 the lake level fluctuation range has been reduced with the elimination of the 2 in 9 year lowering. This has eliminated all levels in the bottom 50 percent of the post 1878 historic range. They will never occur again unless the WQC is rewritten. Now, an elevated lake level is often maintained for a longer time frame. These factors have redistributed the annual wave energy against the upper shoreline profile, which had created a dis-equilibrium of the lakeshore and near shore lake bottom profile.
Dana Murch’s Finding of Fact and Order that Sebago Lake shorelines are adjusting to the 1878 dam is misleading. Evidence of erosion and beach loss only existed when the ancient policy of striving for uniform flow was altered by periods of reduced outflow to increase water storage and/or during a decade of multiple years of higher precipitation. In the middle 40 years of the 20th century, shorelines and beaches were in a state of equilibrium as the force of the three erosion factors were offset by a shorter transgression time, wider lake level fluctuations, and less time lake levels were near full pond (for definition of transgression time and other erosion factors see- Lorang et al. Lake Level Regulation and Shoreline Erosion on Flathead Lake, Montana: A Response to the Redistribution of Annual Wave Energy), Vol. 9 No 2 (1993) Journal of Coastal Research. Unprecedented drastic and permanent loss of beaches then occurred after the post 1987 lake management supercharged the three erosional factors. This was not a lake adjusting to a 109 year old dam but a result of a deliberate 40 percent reduction of outflows in the spring, summer, and fall increasing fall lake levels by 2 to 3 feet above the long term average. In 2023, thanks to the MeDEP WQC’s increased lake level average, reduction in lake level fluctuations, and again long time periods near full pond levels, erosion damage continues unabated. A new “Finding of Fact and Order” for a new WQC should read that the MeWQC has increased the three erosion causation factors that Sebago Lake beaches and shorelines are now exposed to.
5d. Paragraph “c” in the WQC requires correction. Maine DEP WQC 2011 page 36:
“c. Erosion. Virtually all of the 105 miles of shoreline around Sebago Lake is currently stable and is not experiencing significant erosion.(81) Those areas currently subject to erosion are predominantly steep bluffs composed of loose sands and gravels that are inherently unstable. Most erosion-prone shoreline areas have already been protected by retaining walls or riprap and have been stable for many years, despite changing lake levels. However, the shoreline of the lake is in the process of coming into equilibrium with the higher water levels created by the construction of the outlet dam to its current location. As a result, both shoreline erosion and beach recession will continue into the future.”
Dana March’s historical explanation of erosion and shoreline protection is misleading. The first known shoreline protection on Sebago Lake was built immediately after 1917 as that was the year the water level was allowed to rise one foot over the dam and six inches above the existing flowage easement. Later, other excursions above the dam and easement violations occurred, prompting some land owners to protect their land and property. In the late 1940’s after another flowage easement violation, SD Warren Company constructed cribbing with concrete ties and rock on much of the 2 miles of the southwest shoreline in Standish which was not covered by the 1884 flowage easements. This concrete and rock work by SD Warren Company was and still is one of the largest construction projects ever on Sebago Lake. This armoring remained intact and functional until Warren chose to increase summer and fall lake levels after 1986. The resulting high water and seasonal storm action rapidly undermined and disintegrated in numerous locations Warren’s 40 year old shoreline protection. Dana Murch in the WQC does not differentiate between earlier 20th century shoreline protection required for water levels significantly above the dam spillway and the far greater amount of armoring needed now for protection from the MeDEP policy of increased post 1987 water level averages and elimination of the lower 50% of the historical range.
Page 11 RDW FOSL letter to Gov. Mills August 10, 2023
5e. Regarding MSG and SAPPI Beach Profile Studies
On page 36 of the WQC, Footnote 81 after the sentence, “Virtually all of the 105 miles of shoreline around Sebago Lake is currently stable and is
not experiencing significant erosion.(81)” refers the reader to Section 18 starting on page 43 in the WQC. The reader searching for where the information in the first sentence of section C came from must read paragraphs b,c, and d of Section 18 outlining three older beach profiling studies, two by MGS and one by SAPPI.
In the WQC, the MeDEP appears to all of a sudden align with the conclusion by SAPPI, the FERC licensee, to justify the elimination of the 2 in 9 year lowering. Also, MeDEP ignores or cherry picks information from the MGS studies. Footnote 98 on page 44 of the WQC provides the name and date of the SAPPI study, Sebago Lake Beach Profile Study 2002 Work Report, FERC filed date April 21, 2003. It is up to the reader to find the names of the MGS profiling studies on the FERC docket or on the internet. These studies were conducted during several drought years and years where lake level averages more mirrored the long term historical average, thus maintaining a relative stability of the upper beaches. One MGS study noted “catastrophic erosion” at a number of Sebago Lake beaches in 1996 (p.9 Summary of Lake Shoreline Change Studies, 1990-1997, Robert Johnston and Martha Mixon, MGS- MeDOC Robert Marvinney State Geologist 1997). Sebago Lake had experienced lake levels and wind events that were similar to or greater than that which occurred in 1996, which was responsible for the “catastrophic” loss. Before the late 1980’s change in lake management , “catastrophic” beach erosion events were minimized or non-existent because of an adequate volume of beach sediments had established a profile to dissipate wave energy and protect the shoreline from high water wind events. The 1987 to 1996 water levels removed this long established beach profile protection, which MGS never acknowledged. Given the additional catastrophic beach and land loss after 2003, it is inconceivable for the MeDEP in 2011 to make the abstruse blanket statement in the 2011 WQC that shorelines are currently stable. The Songo Spit Beach is unrecognizable from its former location just 25 years ago. This beach was recommended for Critical Areas Designation by the State Planning Office in 1988. It is odd that the stunning rapid loss and retreat of the Songo Spit Beach was not mentioned in the WQC.
The MeDEP WQC statement that the shoreline is still “in the process of coming into equilibrium with the 1878 dam” is grossly misleading. When other large lakes, like Flathead Lake in Montana, experienced increased lake levels due to the completion of
Kerr Dam built in 1933, shoreline and beach erosion were rampant immediately following the dam’s initial operation. For Flathead Lake, erosion took 40 to 50 years on some reflective shorelines to equilibrate, with dissipative delta beaches like river delta beaches taking much longer. (Lorang et al.)
When Dana Murch states in WQC Section c., page 36, that the lake is still adjusting to the 1878 Basin Dam, he omits that significant erosion occurred in much later decades when the lake level average significantly increases due to outflow manipulation and/or increased precipitation years. In about a 40 year period from 1940 to 1980, the beaches and shorelines of Sebago Lake maintained a relative equilibrium with the lake levels. In the first 3 decades after the 1878 Basin Dam was operational, photographic evidence, water level charts, primary written accounts and forest shoreline growth support the evidence that this dam did not appreciably change the average water level or fluctuation range of the lake. Before the 1878 dam, Sebago Lake was no stranger to high water. Historical accounts in one year after the Civil War relate that the water level rose 4 feet six inches or more above the Basin Dam spillway of 261.13 feet msl and remained at that height for a month (Walter Wells, The Water Powers of Maine 1868) . Still, no flowage easements were ever purchased for Sebago Lake shorelines when the Basin Dam was built in 1878. It is probable that a level recorded before the 1878 dam was 266.15’ msl and that is why the charter allows building the 1878 dam to a height of 5 feet above the 1828 dam. In 1884 the lake exceeds this 266.65 msl height by six inches and this trespass required a lake wide effort by the dam owner to secure flowage easements for 101 miles of shoreline. The 258 msl maximum level when stated as a “Finding of Fact” by Dana Murch before the 1828 dam was built is a convenient false assertion to provide State leadership a way out of accepting responsibility from their hand in significantly creating and maintaining higher lake level averages 140 years after the Sebago Lake dam was built, resulting in the destruction of Sebago Lake shorelines.
Dana Murch’s memo of June 29, 2011 (footnote 15 in the Final WQC) cast doubt if the State Hydropower Coordinator understood Sebago Lake’s water lake level history when he was justifying the removal of the 2 in 9 year lowering. WQC P.9:
Under “ Descriptions of Existing Project Facilities”
“Prior to the construction of any dams at the outlet of the lake, lake level varied between a minimum of about 256 feet msl(15) and a maximum of 258 feet msl, and outflows from the Lake varied between a drought flow of about 40 cfs and flood flow of about 29,000 cfs(16).” (Page 9-10, MeDEP Water Quality Certification Finding of Fact and Order) Mr. Murch’s “Finding of fact” setting the maximum pre-dam lake level at 258 msl which is about 8.6 feet below the spillway of the present dam opens for question whether MeDEP ever had a grasp of the historic levels of a pre-dammed Sebago Lake.
In 2011, after Sebago Lake had been exposed to increased water level averages over several decades, the Maine DEP again with their new 2011 WQC proposed to radically change the Sebago Lake outflow policy for the pleasure of SAPPI (SD Warren) and certain boating and recreational interests. Not only is the water level increased but the lower 50 percent of the historic range is totally eliminated.
Past DEP modifications to lake levels and the 2011 WQC lake level stipulations, now the rule for the FERC 2015 Project 2984 license, have inflicted a hidden tax and burden on landowners whose properties are located along beaches and bluffs exposed to large open fetches of water where waves can reach 8 to 12 feet in gale force winds (Hurricane Bob 1992). Not only have landowners lost their land but also expensive rock armoring has been necessary. The elimination of the 2 in 9 year lowering of the lake implemented in 2016 has increased erosion, necessitating funding further shoreline protection. Many property owners have lost a beachfront or only have a remnant beach during the recreational season. Because of skyrocketing property taxes, many property owners must rent their property. A usable beachfront makes for more desirable renting with more economic benefit to the owner to help cover property taxes and upkeep. The WQC never mentions this economic loss from lost beaches in the WQC.
6. Additional Impacts of the MeWQC
A. Clay Strata Erosion- Loss of sand due to the WQC erosion exposes clay strata to storm wave action. Clay particles are suspended in the water column. As clay particles eventually settle out they clean out the water column and a layer of nutrients and organic matter is deposited on the lake bottom. This fuels the growth of phytoplankton and algae, which clogs and reduces oxygenation of the interstitial spaces of the once sandy nearshore lake bottom.
B. Wetland Soil Chemistry- The MeDEP WQC results in permanent inundation of Page 14 RDW FOSL letter to Gov. Mills August 10, 2023
wetland soils due to the WQC eliminating the lower 50% of historic lake levels. The WQC is continuing to alter wetland soil water chemistry, along with reducing plant diversity, which is not conducive to maintaining higher oxygenated wetlands water and soils.
C. Parasites Increase- The MeWQC’s reduction of the lake level range and increasing erosional forces have further changed the nearshore lake bottom habitat from a more dynamic sandy or bare rocky substrate to one covered by eroded soil, clay, and organic matter. The plants and algae that thrive on this nutrient-enriched lake bottom create habitat conditions that promote the growth of snails, which are a necessary host for the parasite flatworm, Shistoma Cercariea. The presence of this flatworm can result in outbreaks of Cercarial dermatitis known as swimmer’s itch. This affects water quality for recreation and is especially problematic for young children who play in shallow water. Swimmer’s itch can occur in any lake, however the severity of the outbreaks residents and visitors are experiencing around Sebago Lake has been remarkable.
D. Invasive Species Domination- The MeWQC creates habitat conditions for invasive species to thrive that are harmful to water quality and stress native species populations. Pike fish could not survive well in the pre-1980’s water levels in the Songo River and other shallow, slow-moving bodies of water. Milfoil growth, harmful to water quality, is particularly suited to the lake level and outflow parameters of the 2011 WQC.
E. Degradation of Downstream River and Marine Ecosystem Environments- The MeWQC is often forcing extreme “drought” outflows from Sebago in the spring to ensure that Sebago Lake’s water level height reaches at least 266.0’ msl and above (266 msl is 6.65” below the spillway). The impacts of the extreme low flow regulation (that has been necessary to satisfy the requirements of the MeDEP WQC) have never been addressed by State regulatory agencies. Negatively affected are the water quality and ecosystems of not only Sebago Lake but also the Presumpscot River, the estuary, Casco Bay, and the fisheries of the Gulf of Maine.
F. Nearshore Water Quality and Recreation Degradation- Loss of sandy beaches, sedimentation of sandy nearshore lake bottom, and clogging of interstitial spaces reduce the filtration capabilities of meiofauna and beneficial bacteria to filter and remove nutrients and organic matter from the water column. Water Quality and swimming recreation suffer.
G. Thermal Pollution and Recreation Loss-The seasonal inflow of bank storage of groundwater around Sebago Lake has been altered by the post 1987 water levels and the WQC. The more constant high lake levels through the summer and early fall months have reduced the inflow of colder spring water into the lake during the warm seasons. This causes an increase in the average lake temperature. In the very late fall and winter the lake is lowered down to 3 to 4 feet below full pond to provide a level that can accommodate the average spring run off. This lowering of the lake causes an increase in bank storage groundwater inflow. Since the temperature of this bank storage inflow is about 40 degrees year round it warms the surface lake water in the cold season and prevents or reduces the amount of surface water freezing in average cold winters. Sebago Lake is unusual in that it is surrounded by vast glacial sand deposits that can contain and release large volumes of this “warm” groundwater. Sebago Lake in its entirety would normally freeze over solid in the Big Bay so that it could support the weight of people and machinery. This provided winter recreation which was valuable to the local economy. Sebago Lake’s new failure to completely freeze over solidly extends far beyond what one would expect from just climate change. The now routinely unfrozen surface of the Big Bay allows solar energy to be absorbed instead of being reflected back into space by ice. Our planet does not need unnecessary additional surfaces of unfrozen waters in the higher latitudes if we are to mediate climate change.
H. Diatom Phytoplankton and Climate Impacts- The WQC allows extreme reductions of Sebago Lake outflows in the spring and early summer to guarantee that lake levels are within six to seven inches of full pond. This is a practice that is very harmful to estuarine, coastal, and ocean ecosystems. Marine plants, like diatoms, evolved to take advantage of the nutrient delivery of the high spring runoff which does not typically occur now due to the WQC. Diatom populations suffer when spring flow volumes are a fraction of the average spring flows, which is what is happening under the guidelines of the WQC. It has been reported that diatom populations in the Gulf of Maine have declined by well over a half in the last 30 years. Diatoms throughout geologic history have been important to the reduction of CO2 in the atmosphere and cooling the climate. With the increasing threat of climate change, it is irresponsible to not consider the impacts of lake level regulation and low spring flows on this foundation of the marine ecosystem, which is a part of the earth’s climate regulating history.
I. Social and Socio-economic Bias- A theme of the WQC is that the lake level requirements “balance competing interests”. The high water interests that economically gain through the WQC have historically held a superior influence with the Governor and legislative government. The users of the State’s Songo Beach and other public beaches are not wealthy and have no influence in regulatory decisions. The leadership of the State of Maine has always recognized this and therefore has a bias against citizens without the economic means to afford large boats and/or own a lakeshore home with a dock along a shallow cove or river. One only has to visit Songo Beach and view the ongoing destruction to ask how socio-economically “balanced” is the WQC.
The four prior governors to your administration have had the opportunity to address the environmental impacts of the abrupt change in Sebago Lake’s water level regulation and have failed to do so. Not one, to my knowledge, has even visited Songo Beach to witness how Maine’s once “most outstanding inland beach” has been ruined by State leadership’s desire to always further appease high-water interests. An atmosphere of fear hovers over the scientific and political community to address what has happened at Sebago Lake. You can go a long way to lift this fear by reopening the WQC and allow State workers and scientists to work free from retaliation to them and their families. I hope you will do what is right and allow the WQC to be rectified.
Sincerely, Roger Wheeler
Roger Wheeler
President, Friends of Sebago Lake
Summer address:
27 Long Point Road, Standish, Me. 04084 Winter address:
10 Ryan Ave.,Ipswich Ma. 01938
Cell: 207-256-7525
Email: friendsofsebago@yahoo.com
Cc:
Kyle Olcott- DEP Hydropower Supervisor Kyle.Olcott@maine.gov Melanie Loyzim- DEP Commissioner melanie.loysim@Maine.Gov Amanda Beal- DACF Commissioner amanda.beal@maine.gov Stephen Kasprzak
Deb Boxer
Charles Fizer
Ted Tibbals
Richard Vande hei
Don Davis
Diana Wheeler
Brad Hammond
Meredith Wheeler
Dana Wheeler
Tami Chase
Jonathon DiCescare JD@elevatepower.com
Tashia Pinkham- Standish Town Manager


Page 18 RDW FOSL letter to Gov. Mills August 10, 2023
APPENDIX A
Dana Murch DEP-DWRM
Maine Department of Environmental Protection 17 State House Station
Augusta, ME 04333-017
Subject:
S. D. Warren’s Pending Application for Water Quality Certification
June 23, 2009
(WQC) For Eel Weir Dam Hydroelectric Project FERC #2984 Should Take Into Account The Fact That Sebago Lake is A Natural Lake With Natural Wetlands and Eel Weir Did Not Raise The Natural Lake Level By 9 Feet
Dear Dana:
You wrote a letter to Tom Howard on September 13, 2002, in which you referenced data in a book Water Powers of Maine, by Walter Wells (Augusta 1869) and you concluded the following :
“Thus, it would appear from this evidence that the current dam has raised natural levels of Sebago Lake by a total of 9 feet.”
Your interpretation of the data is inconsistent with the following quotes from a book titled The Cumberland and Oxford Canal and the Canal Bank, by Philip I. Milliken, Original printing 1935,:
p. 21
“The engineer, Holmes Hutchins, who was hired to survey and give an estimate of
the undertaking, gave a lengthy report and the following pertinent facts among his records. “the distance as the Canal would be located, is 15 3⁄4 miles, and the descent 248 68/100 feet In making the examination, an object of considerable importance was to ascertain whether a sufficient supply of water could be obtained without diminishing the quantity that usually flows down the Presmpscot River during the summer
season” (Emphasis added.)
p. 22
“The Sebago Pond contains by computation a surface of thirty square miles, and by raising a dam across the outlet near White’s Bridge or at the foot of the basin one mile lower down of four feet above the ordinary low water in the Pond, no doubt can supply for the Canal, but make a great addition to the outlet.” (Emphasis added.)
Dana Murch Page Two June 23, 2009 p. 23
I have also passed over the ground between Sebago and Long Ponds. The
navigation may be good by constructing a Dam across the Songo river, of five feet
in height, below the rapids near the mouth of Crooked River and making a Lock of equal lift to pass Boats.”
and the following quoted from S. D. Warren’s 1979 Application for License for the Eel Weir Project:
“It is not known exactly when the first dam at the head of the Presumpscot River was constructed. In 1827, however, the Cumberland and Oxford Canal Company erected a wooden dam at the site to facilitate navigation. The C & O Canal Company was in operation from 1829 to 1874 and it is part of this abandoned canal that forms the link between the head dam and Eel Weir powerhouse. The present head dam structure was built by the Presumpscot Water Power Company in 1878-79 to a crest height of 261.65 (M.S.L.), but raised to its present height in 1884.
The C & O Canal Company dam would have been built in such a way as to serve the needs of navigation. In other words, it would have incorporated the physical
structures needed to divert flows from the river to the Eel Weir Canal, and would have impounded enough water to allow boats to (hopefully) use the so-called Basin (which is a stretch of the river impounded by the dam) and the downstream canals throughout the open-water season. To meet these needs, the dam may or may not have significantly affected the natural levels of the lake.” (Emphasis added.)
The quote you referred to in your letter by Wells was:
“There is a dam eight feet high at the outlet of Sebago Lake, by which a head of four feet
is now commanded over the whole surface.”
This sentence does not say that the dam raised the lake level four feet and maintained it there. If it did raise the lake level four feet and maintained it there, then they wouldn’t have needed to build the Songo Locks with five feet of lift in order to navigate the Songo rapids because the water level from the outlet of Songo River upstream to the Lock is level under normal flow conditions.
Dana Murch Page Three June 23, 2009
Furthermore, it is my understanding that the original Songo Locks and dam, built around 1827, are still in operation today, and the height of the dam is still the same. If the lake level was raised five feet in 1878 when the Eel Weir Dam was raised five feet, then the original Songo Lock and dam would have been flooded over and there and there would be no need for their continued operation.
I believe that the natural lake level graph for Sebago Lake is bell shape with an annual range of seven to eight feet, and the 1827 dam at the foot of the Basin allowed four feet of this range to be commanded for navigation in the Basin and canal.
Mr. Wells also wrote that Sebago had an “estimated discharge of the river for the year, 20,400, – volume.000,000 cubic feet.”
This annual discharge of 20.4 billion cubic feet would use a head of 14.63 ft. according to figures supplied by Mr. Wells, and I believe this would translate into a natural range of seven to eight feet because of the relative uniformity in monthly precipitation totals.
Sebago Lake is a natural lake and its natural outlet, at what is now known as White’s Bridge, was less than forty feet wide and much shallower and resulted in the natural shaped bell curve with the maximum water level typically in May or June because of the spring runoff. I base these observations on old photographs and the unnatural existing pile of rocks near White’s Bridge along the southerly shoreline upstream of the Bridge.
I believe these rocks represent evidence that this channel was made deeper at the same time that the eight foot dam was built. Both projects were undertaken to assist in the navigation of canal boats This natural outlet was significantly narrower than the 80 foot long and 8 foot high stone dam built in 1827 and the 115 foot long stone masonry spillway section at the current dam..
The Eel Weir dam was built at the foot of the basin, which was approximately one mile downstream of White’s Bridge, and its elevation is shown as “0” on the graphs in Appendix 1. Its
main function was to assist navigation in the canal and basin by reserving some of the enormous annual outflows from the lake by increasing storage capacity of the spring runoff in Sebago Basin.
Wells wrote the following about the natural uniformity of the flow in the Presumpscot River and the benefits of the artificial control provided by the stone dam:
____________________________________________________________________________ Dana Murch Page Four June 23, 2009
“The Presumpscot proper, from Sebago Lake to the Length, tide, by the course
of the river, is about 22 miles long. Crooked river is estimated to be 42 miles long. Estimated discharge of the river for the year, 20,400, – volume. 000,000 cubic feet.
These are, and even in the state of nature would be, variation of comparatively small upon the Presumpscot proper, volume-owing to the great extent and compensating influence of the grand reservoir at its head. The natural uniformity of the stream is assisted by the artificial control of the delivery of the lake, so that for the practical purposes of extensive manufacturing it is constant throughout the year. The volume employed at Cumberland Mills, estimated from the statement of the Superintendent, George W. Hammond, Esq., is about 50,000 cubic feet per minute. This run continued throughout the working days of the year, for ten hours a day, would carry off about 9.5 billion cubic feet.”
According to Mr. Wells, the estimated annual discharge of the Presumpscot River was 20.4 billion cubic feet, and there was “even in the state of nature,” a comparatively small variation in this discharge “owing to the great extent and compensating influence of the grand reservoir at its head.”
Also, according to Mr. Wells, the Presumpscot had “natural uniformity” of flow. The construction of the eight foot high stone dam in 1830 assisted this flow of natural uniformity so it was “constant through the year” for “the practical purposes of extensive manufacturing.”
The annual flow of 9.5 billion cubic feet for manufacturing was about half of the annual natural discharge of 20.4 billion cubic feet, and with all other things being equal, would only use about 6.74 ft. of Sebago’s water.
As shown on water level graphs in Appendix 1, for the years 1872-75 the maximum lake levels were typically 264.0 to 264.5 ft. msl, which is about 1.15 ft. below the current spillway, and lake
levels dropped as low as 258.5 ft. msl. The annual range in lake levels , according to these graphs, was typically 5 to 6 feet, and the following was written in Water Powers of Maine
“The range from lowest to highest water is found to be on the several dams in Westbrook, from four to five feet; at the Outlet dam, four to five feet.”:
______________________________________________________________________________ Dana Murch Page Five June 23, 2009
Total precipitation for the years 1872-75 was below normal, but in years of high spring run-off and/or above normal precipitation, a head as high as 4’-9” would be created at the stone dam, according to the following statements written in Water Power of Maine:
“There is a dam eight feet high at the outlet of Sebago Lake, by which a head of four feet is now commanded over the whole surface. It can be raised four feet more, as I am informed by Mr. Hammond, without incurring more than very trifling damage for flowage.”
and
“W. H. Jackson, Esq., President of the Oriental Powder Company, writes as follows in regard to the volume of water that can be had from the tributary
country: “I have run water at Westcott’s falls, where the lake waters enter the river, for 32 days, through four gates four feet square each, and one six feet square, under a ten- foot head, with a flow four feet deep over the dam eighty feet long, and even then have not succeeded in preventing the water from rising six to nine inches above the four feet head on the dam, which is all the dam will now safely carry. These figures indicate an enormous waste of water, much the greater part of which, with a suitable dam, can be reserved for manufacturing use.”
If you envision a graph of the above described high flow event of 32 days with a 4 foot head which at times would rise another 6 to 9 inches on the graph in Appendix 2, it is obvious that the Eel Weir Dam did not significantly raise the natural maximum water level of Sebago.
During these periods of high spring run-off, the lake levels would rise another 1.5 to 2 feet higher than plotted on the 1872-75 graphs in Appendix 1 and expand the annual range to 7 to 8 feet. The stone dam was at elevation 261.62 ft msl and adding the 4.75 ft. of head as discussed above by Mr. W. H. Jackson, Esq., would make the water level of the head during these high flow events 266.38 ft. msl, which is only 3.5 inches below the height of the current spillway.
I believe that this 4.75 ft. head behind the 8 ft. dam used to occur naturally upstream of the natural outlet at White’s Bridge before it was dredged lower for navigation of canal boats. The designers of the dam did not adequately take into account the increased flow from White’s Bridge after the channel had been dredged deeper. I do not believe that the Oriental Powder Company would have designed a dam which would have a 4.75 ft. head during high flow events, and thereby, waste so much water.
Dana Murch Page Six June 23, 2009
The natural head stream of White’s Bridge is why Mr. Hammond stated the dam could be raised
4 feet more .” . . . without incurring more than very trifling damage for flowage.”
There is also other physical evidence that this 4.75 ft. head occurred naturally upstream of White’s Bridge and that is the height of Sebago’s Holocene beaches. These beaches are higher than the current spillway and obtained these heights naturally during high wind events, when lake levels were at or near full pond for only a few weeks of the year.
There is no physical evidence along Sebago’s shoreline or in its wetlands upstream of White’s bridge that Eel Weir Dam significantly raised water levels in the lake. If lake level was raised 9 feet, then we should see many tree stumps at elevations up to 9 feet below full pond along Sebago’s shoreline and in its wetlands, as well as submerged trees in the forested wetlands when lake levels are near full pond..
There are none, but we can see tree stumps in the Basin, which provides evidence that water levels were raised 4 feet in the lower section of the Basin when the dam was built in 1827 and were raised another 5 feet in 1878 when the dam was raised 5 feet.
The annual water level graph was still bell shaped after the dam was raised 5 feet in 1878, but it became wider as the length of time which the spring run off levels were maintained was increased.
This change meant that the trees in Sebago’s forested wetlands were submerged for a longer period of time, and the trees eventually died. Today, you can still see the tree stumps around the perimeter of Sebago’s palustrine wetlands, and they are in waters only one to three feet below today’s full pond level.
The lack of tree stumps at elevations up to 9 feet below full pond along Sebago’s shoreline and in its wetland and the submerged stumps upstream of White’s Bridge in only 1 to 3 feet of water
around the edges of some of Sebago’s wetland submerged trees provides clear evidence that the original construction of the eighty foot stone dam in 1827 and the addition of another five feet in 1878 did not significantly raise Sebago’s water levels above the maximum level that occurred during spring runoff, did not significantly
______________________________________________________________________________ Dana Murch Page Seven June 23, 2009
alter Sebago’s natural wetlands or change the range of natural intra- and inter-annual variability of its water levels.
Sincerely,
Stephen M. Kasprzak
Encs.
cc: Roger Wheeler, President, FOSL
Douglas Watts, Executive Officer, FOSL
Commissioner David P. Littell, Maine Department of Environmental Protection Commissioner Patrick K. McGowan, Maine Department of Conservation
Dana Murch, Maine Department of Environmental Protection
Commissioner Roland D. Martin, Maine Department of Inland Fisheries & Wildlife
Sarah LaChance, Campaign Earth
Nelson Thompson
Ben Chapman
Theodore Tibbals
Ron Miller, President, Portland Water District
Gary Lorfano, President, Portland Water District Trustees
Paul Hunt, Environmental Services Manager, Portland Water District
Nathan Whalen, Water Resource Specialist, Portland Water District
Thomas Howard, S. D. Warren
SMK/gcl
Appendix B

